Karl asked a question some time ago, in which he wanted to know how one can produce this graph. As I pointed out in my reply, it is rather easy, if we can rotate the data file by 90 degrees. I will only post a skeleton here, you can dress up the graph at your will.
For a start, here is our data file, which we will call 'out.dat'
These were produced in octave by the function
Anyway, this is what we have to do:
This is really simple: We plot the contours by plotting 'out.dat', and 'out2.dat' column by column, and keeping the first and second coordinates constant. In this way, we "project" those columns onto the y-z and x-z planes. In order to make the contours more visible, we have to specify an xrange and yrange which is a bit bigger, than our actual data set. At the end, we plot the data file as surface. If we set the contour beforehand, we will see the contours on the bottom.
And here is the figure that we have just produced. Don't be fooled by the fact that there are only three lines on the x-z plane: since our function was symmetric in y with respect to, some contour lines will overlap. And again, this graph should still be properly annotated.
![]()
For a start, here is our data file, which we will call 'out.dat'
-0.299 -0.265 -0.215 -0.151 -0.078 0.000 0.078 0.151 0.215 0.265 0.299and its "rotated" pair, 'out2.dat'
-0.513 -0.455 -0.368 -0.259 -0.134 0.000 0.134 0.259 0.368 0.455 0.513
-0.694 -0.616 -0.499 -0.351 -0.181 0.000 0.181 0.351 0.499 0.616 0.694
-0.833 -0.738 -0.596 -0.411 -0.191 0.037 0.243 0.430 0.600 0.739 0.833
-0.919 -0.812 -0.624 -0.271 0.287 0.736 0.767 0.658 0.697 0.819 0.920
-0.949 -0.832 -0.582 0.048 1.186 2.000 1.680 1.007 0.781 0.851 0.949
-0.919 -0.812 -0.624 -0.271 0.287 0.736 0.767 0.658 0.697 0.819 0.920
-0.833 -0.738 -0.596 -0.411 -0.191 0.037 0.243 0.430 0.600 0.739 0.833
-0.694 -0.616 -0.499 -0.351 -0.181 0.000 0.181 0.351 0.499 0.616 0.694
-0.513 -0.455 -0.368 -0.259 -0.134 0.000 0.134 0.259 0.368 0.455 0.513
-0.299 -0.265 -0.215 -0.151 -0.078 0.000 0.078 0.151 0.215 0.265 0.299
-0.299  -0.513  -0.694  -0.833  -0.919  -0.949  -0.919  -0.833  -0.694  -0.513  -0.299
-0.265  -0.455  -0.616  -0.738  -0.812  -0.832  -0.812  -0.738  -0.616  -0.455  -0.265
-0.215  -0.368  -0.499  -0.596  -0.624  -0.582  -0.624  -0.596  -0.499  -0.368  -0.215
-0.151  -0.259  -0.351  -0.411  -0.271  0.048   -0.271  -0.411  -0.351  -0.259  -0.151
-0.078  -0.134  -0.181  -0.191  0.287   1.186   0.287   -0.191  -0.181  -0.134  -0.078
0.000   0.000   0.000   0.037   0.736   2.000   0.736   0.037   0.000   0.000   0.000
0.078   0.134   0.181   0.243   0.767   1.680   0.767   0.243   0.181   0.134   0.078
0.151   0.259   0.351   0.430   0.658   1.007   0.658   0.430   0.351   0.259   0.151
0.215   0.368   0.499   0.600   0.697   0.781   0.697   0.600   0.499   0.368   0.215
0.265   0.455   0.616   0.739   0.819   0.851   0.819   0.739   0.616   0.455   0.265
0.299   0.513   0.694   0.833   0.920   0.949   0.920   0.833   0.694   0.513   0.299
These were produced in octave by the function
f(x,y) = sin(y/4)*cos(x/4)+exp(-x*x - y*y/3)Instead of actually rotating the date file, I simply interchanged the variables, and printed out the file for a second time, for I was a bit lazy...
Anyway, this is what we have to do:
reset
unset key
set contour base
set pm3d at ss

set xrange [-2:10]
set yrange [0:12]

splot for [i=1:10:2] 'out.dat' u (-2):0:i w l lt i, \
for [i=1:10:2] 'out2.dat' u 0:(12):i w l lt i,\
'out.dat' matrix w pm3d
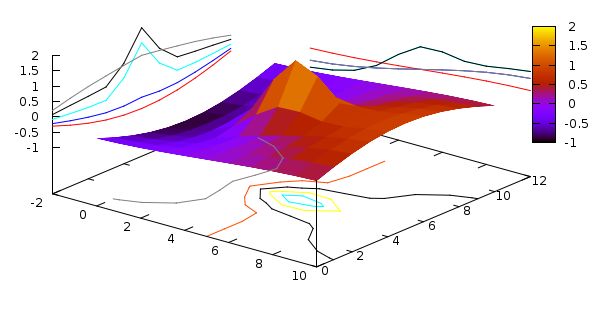
This is really simple: We plot the contours by plotting 'out.dat', and 'out2.dat' column by column, and keeping the first and second coordinates constant. In this way, we "project" those columns onto the y-z and x-z planes. In order to make the contours more visible, we have to specify an xrange and yrange which is a bit bigger, than our actual data set. At the end, we plot the data file as surface. If we set the contour beforehand, we will see the contours on the bottom.
And here is the figure that we have just produced. Don't be fooled by the fact that there are only three lines on the x-z plane: since our function was symmetric in y with respect to, some contour lines will overlap. And again, this graph should still be properly annotated.