One of the major advantages of open-source code is that if you would like to add some new features, you can easily do that. This applies to gnuplot, too, in fact, doing that does not require anything special. I have been quite inactive on this blog recently, and the reason is that Philipp Janert and I have been working on a patch to gnuplot.
The steps of patching gnuplot are described on gnuplot's main web page. There are a number of patches uploaded to gnuplot's patch tracker, on which quite a few new features, still in the development phase, are published. It is really worthwhile to try them out, first, to provide feedback as to what is useful and what is not, and second, to help the developers to find bugs and other glitches, like what the syntax of a command should be and so on.
Our patch is related to an old debate as to what gnuplot really is. At many a place, you will find the statement that "gnuplot is a plotting utility, not a statistical analysis package". I have nothing against this statement, however, when saying so, we have to tell what we mean by plotting. So, is plotting just placing a thousand dots at positions that represent our data? Or do we want more? E.g., throwing out data points that are unreasonably far from the mean. Or showing the mean, and the standard deviation? Or calling the reader's attentional to some special points, like the minimum or the maximum in a data set? And many similar things. I believe, plotting requires much more, than just showing the measurement data: a plot makes sense only, if we can point out what is to be pointed out. By the way, fitting falls into this category, and fitting has been an integral part of gnuplot for ages. The point being that the original statement (gnuplot is a plotting utility, not a statistical analysis package) has been wrong for a long time.
The patch that I mentioned above was announced yesterday on the gnuplot development mailing list and you can find the patch for the source and the
documentation on patch tracker. I have put a couple of examples on my gnuplot web site under patch. You can also find the full documentation.
I would like to ask you, if you feel crafty and you can, download the patch, and try it, and let us know whether you find it useful, what else, do you think, we could do with it and so on. It would really help the development. Once the patch makes it to the main code, I will discuss various option on these pages.
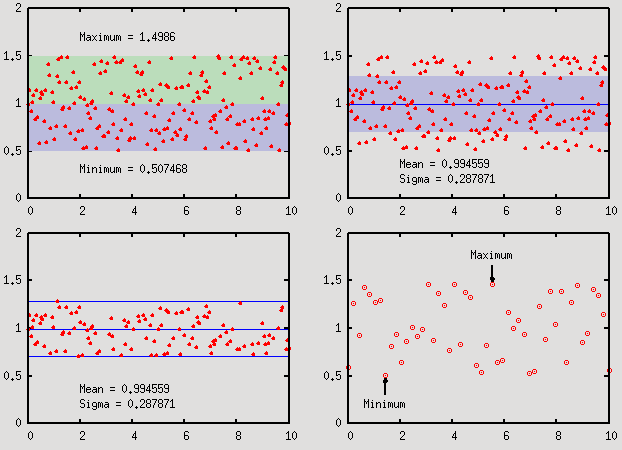
Just to wet your appetite, here is a figure that you could very easily make with the new patch. (You can find the code on my web site.)
![]()
Many cheers,
Zoltán
The steps of patching gnuplot are described on gnuplot's main web page. There are a number of patches uploaded to gnuplot's patch tracker, on which quite a few new features, still in the development phase, are published. It is really worthwhile to try them out, first, to provide feedback as to what is useful and what is not, and second, to help the developers to find bugs and other glitches, like what the syntax of a command should be and so on.
Our patch is related to an old debate as to what gnuplot really is. At many a place, you will find the statement that "gnuplot is a plotting utility, not a statistical analysis package". I have nothing against this statement, however, when saying so, we have to tell what we mean by plotting. So, is plotting just placing a thousand dots at positions that represent our data? Or do we want more? E.g., throwing out data points that are unreasonably far from the mean. Or showing the mean, and the standard deviation? Or calling the reader's attentional to some special points, like the minimum or the maximum in a data set? And many similar things. I believe, plotting requires much more, than just showing the measurement data: a plot makes sense only, if we can point out what is to be pointed out. By the way, fitting falls into this category, and fitting has been an integral part of gnuplot for ages. The point being that the original statement (gnuplot is a plotting utility, not a statistical analysis package) has been wrong for a long time.
The patch that I mentioned above was announced yesterday on the gnuplot development mailing list and you can find the patch for the source and the
documentation on patch tracker. I have put a couple of examples on my gnuplot web site under patch. You can also find the full documentation.
I would like to ask you, if you feel crafty and you can, download the patch, and try it, and let us know whether you find it useful, what else, do you think, we could do with it and so on. It would really help the development. Once the patch makes it to the main code, I will discuss various option on these pages.
Just to wet your appetite, here is a figure that you could very easily make with the new patch. (You can find the code on my web site.)
Many cheers,
Zoltán